All the code for Grafana and a demo API can be found here. All runnable.
Introduction
Today we are going to learn how to setup a dotnet API which sends logs and metrics to Grafana.
There are many components to this that will come into play. But let’s start with the some definitions.
Logs — Just some information we want to save (logging an exception).
Metrics — Time based statistics (how many requests per hour).
Traces — Actions performed by a specific user over time.
In this tutorial, we will go over all 3, but mainly focus on Logs and Metrics.
How Data Flows
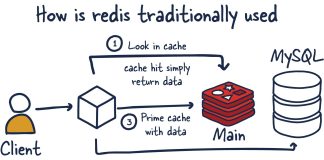
Here is a simple illustration of how the data flows

The Different Components
- API — This is obviously your API. It can do whatever you want it to do. This guide assumes it is a dotnet C# API.
- Collector — Collects metrics and traces from your API and sends them go various data sources.
- Prometheus/Jaeger/Loki — These are all data sources. They save different types of data. Prometheus saves time series data, aka metrics. Jaeger is for traces. Loki is for logs.
- Grafana — Just a configurable UI for viewing the data in the different data sources.
One thing I would like to add is for Metrics and Traces, we will be using OpenTelemetry data. All Open Telemetry does is describe how our data looks or is structured. It is like a blue print. That way all these different components know how to talk to each other.
If we tell our API that we want our metrics sent in the OpenTelemetry format, then it will build it that way and everything else down stream will know how to read that data.
Code Time
You can find all the code with runnable projects here. In fact, it is probably easier to follow the steps there but I will do my best.
Update your Program.cs file.
var env = "Local";
var appId = "1234";
var appName = "Todo Sample API";

// Setup Logging
builder.Host.UseSerilog((context, config) =>
{
  config.Enrich.FromLogContext();
  config.Enrich.WithExceptionDetails();
  config.Enrich.With(new SerilogEnricher(
    appId,
    appName,
    env
  ));

  config
    .WriteTo.GrafanaLoki
    (
      "http://localhost:3100",
      new List<LokiLabel> { new() { Key = "appId", Value = appId }, new() { Key = "appName", Value = appName }, new() { Key = "env", Value = env } }
    )
    .WriteTo.Console
    (
      outputTemplate: "{Timestamp:yyyy-MM-dd HH:mm:ss.fff zzz} level=[{Level:u3}] appId={ApplicationId} appName={ApplicationName} env={Environment} {Message:lj} {NewLine}{Exception}"
    );
  config.ReadFrom.Configuration(context.Configuration);
});

// configure metrics for grafana
var otel = builder.Services.AddOpenTelemetry();

// Configure OpenTelemetry Resources with the application name
otel.ConfigureResource(resource =>
  {
    resource.AddService(serviceName: $"{appName}");
    var globalOpenTelemetryAttributes = new List<KeyValuePair<string, object>>();
    globalOpenTelemetryAttributes.Add(new KeyValuePair<string, object>("env", env));
    globalOpenTelemetryAttributes.Add(new KeyValuePair<string, object>("appId", appId));
    globalOpenTelemetryAttributes.Add(new KeyValuePair<string, object>("appName", appName));
    resource.AddAttributes(globalOpenTelemetryAttributes);
  });

// Add Metrics for ASP.NET Core and our custom metrics and export to Prometheus
otel.WithMetrics(metrics => metrics
    .AddOtlpExporter(otlpOptions =>
    {
      otlpOptions.Endpoint = new Uri("http://localhost:4317");
    })
    // Metrics provider from OpenTelemetry
    .AddAspNetCoreInstrumentation()
    .AddMeter(appName)
    // Metrics provides by ASP.NET Core in .NET 8
    .AddMeter("Microsoft.AspNetCore.Hosting")
    .AddMeter("Microsoft.AspNetCore.Server.Kestrel")
    .AddPrometheusExporter());

// Add Tracing for ASP.NET Core and our custom ActivitySource and export to Jaeger
otel.WithTracing(tracing =>
{
  tracing.AddAspNetCoreInstrumentation();
  tracing.AddHttpClientInstrumentation();
  tracing.AddSource(appName);
  tracing.AddOtlpExporter(otlpOptions =>
  {
    otlpOptions.Endpoint = new Uri("http://localhost:4317");
  });
  // tracing.AddConsoleExporter();
});

var app = builder.Build();

// more configuring metrics for grafana
app.UseOpenTelemetryPrometheusScrapingEndpoint();
Add a SerilogEnricher.cs file
using Serilog.Core;
using Serilog.Events;

public class SerilogEnricher : ILogEventEnricher
{
    private readonly string _ApplicationId;
    private readonly string _ApplicationName;
    private readonly string _EnvironmentName;

    public SerilogEnricher(string applicationId, string applicationName, string environmentName)
    {
        _ApplicationId = applicationId;
        _ApplicationName = applicationName;
        _EnvironmentName = environmentName;
    }

    public void Enrich(LogEvent logEvent, ILogEventPropertyFactory propertyFactory)
    {
        logEvent.AddPropertyIfAbsent(propertyFactory.CreateProperty("ApplicationId", _ApplicationId));
        logEvent.AddPropertyIfAbsent(propertyFactory.CreateProperty("ApplicationName", _ApplicationName));
        logEvent.AddPropertyIfAbsent(propertyFactory.CreateProperty("Environment", _EnvironmentName));
    }
}
Install nuget packages
dotnet add package Serilog && /
dotnet add package Serilog.AspNetCore && /
dotnet add package Serilog.Exceptions && /
dotnet add package Serilog.Extensions.Hosting && /
dotnet add package Serilog.Settings.Configuration && /
dotnet add package Serilog.Sinks.Grafana.Loki && /
dotnet add package OpenTelemetry.Exporter.Console && /
dotnet add package OpenTelemetry.Exporter.OpenTelemetryProtocol && /
dotnet add package OpenTelemetry.Exporter.Prometheus.AspNetCore --version 1.11.0-beta.1 && /
dotnet add package OpenTelemetry.Exporter.Zipkin && /
dotnet add package OpenTelemetry.Extensions.Hosting && /
dotnet add package OpenTelemetry.Instrumentation.AspNetCore && /
dotnet add package OpenTelemetry.Instrumentation.Http
You will need a place to put a bunch of files and folders for Grafana. You can find them all here.
Run the API and Grafana
- Run the Docker Compose file for Grafana
cd grafana
docker compose up - Run the API (this is the sample api from that GitHub repo)
cd TodoApi
dotnet build
dotnet run
Creating and Viewing Logs and Metrics
1. Follow the steps in the previous section
2. Go to the Grafana page
3. Enter your default credentials
username: admin
password: admin
4. You will be prompted to update your password. Do so.
5. After the API starts up, go to the swagger page.
6. Run a few endpoints
7. Go back to Grafana and go to the explore tab.
8. Click on the labels dropdown and select any of the suggested labels.
9. Do the same for the value dropdown.
10. Click the blue Run Query button and you will see your logs!
11. Now go to the dashboards tab
12. Click the blue `Create Dashboard` button
13. Click `Import a dashboard`
– If prompted that you have unsaved changes, click Discard
14. Paste the json from this file
15. Click Load, then Import.
16. There are your first metrics!
17. Go back to the dashboards tab
18. Click the new dropdown and click import
19. Add the other dashboard json
20. Click Load then Import
21. Go back to the dashboards tab
23. Open up the dashboard, `ASP.NET Core`
24. Now any endpoints that show up in the bottom 3 tables, you can click and you will be redirected to the dashboard we set up in step 19.
25. To stop the API, just press `ctrl + c`
26. To stop the docker containers, just press `ctrl + c`
There you go!
Setting up a Remote Server
If you want to put this somewhere like on a VPS or Droplet, you definitely can! Here are a few things to keep in mind though.
- This is an unsecured logging server. So anyone with the loki or prometheus endpoints can flood your servers. Very unlikely but you never know.
- The way I am sending logs to Loki is through an http endpoint. So all you need to do is set up a domain with ProxyPass to `http://127.0.0.1:3100`. I also turn off all CORS policies.
- The way metrics and traces are sent are through gRPC, not HTTP. So you don’t need a virtual host. Instead, you should just open up a port for `4317`.
- If you do stand this stuff up in a VPS somewhere, remember to update the endpoints in your API project. Loki can point to a domain but Prometheus needs to point to an IP address with the port.
Other Dashboards
Grafana provides so many dashboards. You can find more here. The one I used in this demo project is a modified version of this dashboard.


