Metrics report diagnostics about your app. .NET 8 adds over a dozen useful metrics to ASP.NET Core:
- HTTP request counts and duration
- Number of active HTTP requests
- Route matching results
- Rate limiting lease and queue durations
- SignalR transport usage
- Low-level connection and TLS usage from Kestrel
- Error handling diagnostics
- And more
Metrics are numerical measurements reported over time. For example, each HTTP request handled by ASP.NET Core has its duration recorded to the http.server.request.duration metric. Tooling such as the .NET OpenTelemetry SDK can then be configured by an app to export metric data to a telemetry store such as Prometheus or Azure Monitor. Metrics are part of the OpenTelemetry standard and all modern tools support them.
Metrics data are useful when combined with tooling to monitor the health and activity of apps:
- Display graphs on a dashboard to observe your app over time. For example, view activity from people using the app.
- Trigger alerts in real-time if the app exceeds a threshold. For example, send an email if request duration or error count exceeds a limit.
Using metrics
ASP.NET Core’s built-in metrics are automatically recorded. How you use these metrics is up to you. Let’s explore some of the options available.
.NET Aspire dashboard
.NET Aspire is an opinionated stack for building observable, distributed applications. The Aspire dashboard includes a simple, user-friendly UI for viewing structured logs, traces and metrics. Aspire apps are automatically configured to send telemetry data to the dashboard during development.
A recording of the .NET Aspire dashboard metrics, image
Here you can see a collection of available metrics, along with name, description, and a graph of values. The Aspire UI includes metrics filters. Filtering is possible using a powerful feature of metrics: attributes.
Each time a value is recorded, it is tagged with metadata called attributes. For example, http.server.request.duration records a HTTP request duration along with attributes about that request: server address, HTTP request method, matched route, response status code and more. Attributes can then be queried to get the exact data you want:
- HTTP request duration to a specific endpoint in your app, e.g.
/product/{name}. - Count the number of requests with
4xxHTTP response codes. - View request count that threw a server exception over time.
- HTTP vs HTTPS request duration.
- Number of visitors using HTTP/1.1 vs HTTP/2.
ASP.NET Core Grafana dashboards
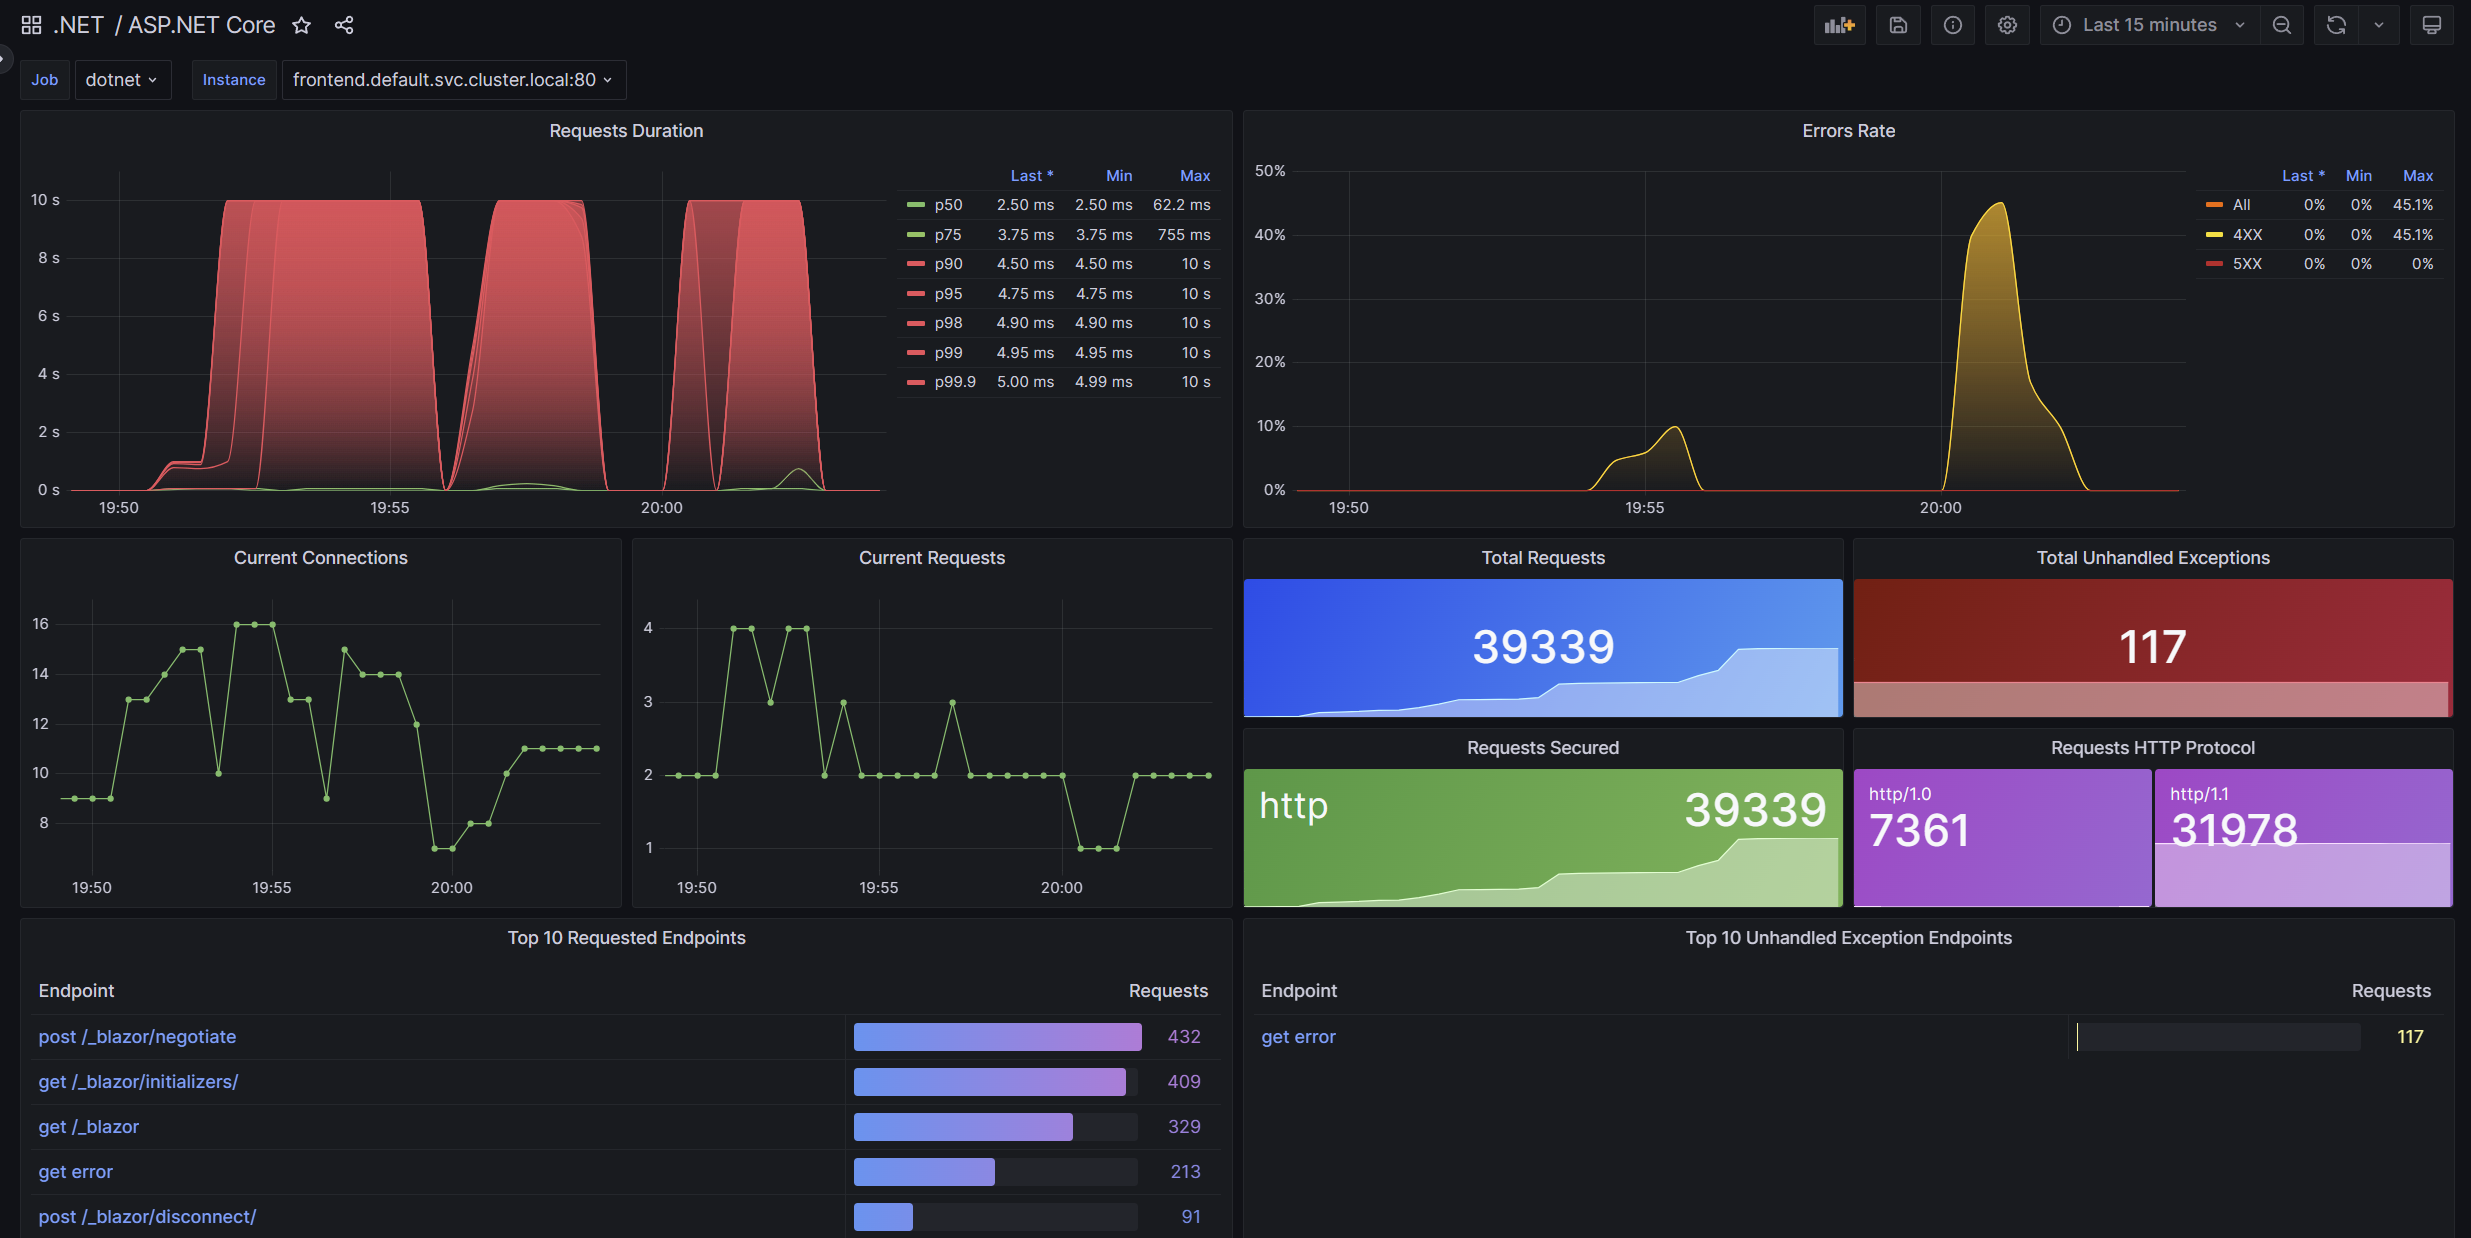
Grafana is powerful open-source tool for building advanced dashboards and alerts. It allows you to create interactive, customizable dashboards with a variety of panels, graphs, and charts. Once complete, a dashboard displays data from your telemetry store. Grafana is a good choice to monitor apps deployed to production and a dashboard gives a real-time view of an app health and usage.
Grafana gives you the power to build exactly what you want, but it takes time to build high-quality dashboards. As part of adding metrics in .NET 8, the .NET team created pre-built dashboards designed for ASP.NET Core’s built-in metrics.

The ASP.NET Core Grafana dashboards are open source on GitHub and available for download on grafana.com. You can use the dashboard as they are or customize them further to build a solution tailored to your needs.
Quickly try out Grafana + ASP.NET Core using the .NET Aspire metrics sample app.
And more
- Metrics aren’t limited to what is built into .NET. You can create custom metrics for your apps.
- dotnet-counters is a command-line tool that can view live metrics for .NET Core apps on demand. It doesn’t require setup, making it useful for ad-hoc investigations or verifying that metric instrumentation is working.
- Use metrics in unit tests. ASP.NET Core integration testing,
MetricCollectorandIMeterFactorycan be combined to assert values recorded by a test.
Try it now
.NET 8, ASP.NET Core Grafana dashboards and .NET Aspire (preview) are available now. Try using metrics today and let us know what you think:
- Download the latest .NET 8 release.
- Use metrics in your tool of choice:
- Learn more about the .NET Aspire dashboard and get started.
- Download ASP.NET Core Grafana dashboards.
- Install
dotnet-counterscommand-line tool.
Thanks for trying out .NET 8 and metrics!


